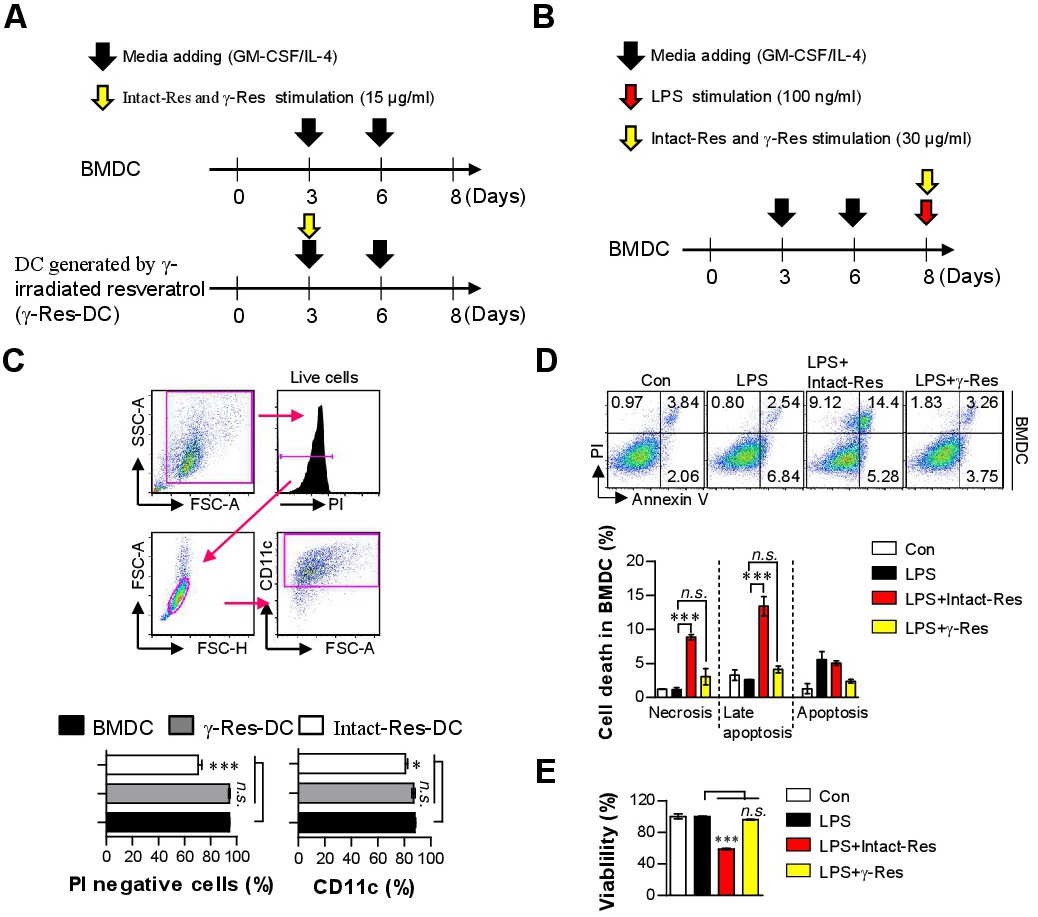
Fig. 2. Cell viability by γ-Res treatment during DC differentiation and in LPS-activated BMDCs. Schematic diagram for the phenotype and functional analysis of DCs (γ-Res-DCs) generated by γ-Res treatment (15 μg/mL) during DC differentiation (A) and the evaluation of the anti-inflammatory activity by the γ-Res treatment in LPS-activated BMDCs (B). Details regarding this experiment are provided in the Methods section (C). After DC differentiation for 8 days, BMDCs, intact-DCs and γ-Res-DCs were stained with anti-CD11c and PI Abs, and then, the cells were analyzed by flow cytometry. BMDCs were treated with LPS (100 ng/mL), LPS with intact-Res (30 μg/mL), or LPS with γ-Res (30 μg/mL) for 24 h, and cell toxicity was determined using an Annexin V/PI staining (D) and EZ-Cytox cell viability kit (E). The results are representative of three independent experiments. All bar graphs show the means ± SD of four samples per group. Con: untreated BMDCs, LPS-treated BMDCs (LPS), LPS+Intact-Res: BMDC treated with LPS and intact resveratrol, LPS+γ-Res: BMDC treated with LPS and γ-Res. ***p<0.001. n.s., no significant effect.